When I was a teenager I tracked my body length on the side of my wardrobe. When the wardrobe got trashed, I copied the length markings over on a piece of paper. Recently I found this paper again and decided it would be nice to plot the data. The data processing actually took me on an interesting journey which involved data interpolation and polynomial regression.
Summary
How I turned this

into this
The measurement
The length measurements were done as follows. I would stand straight against my clothing closet and one of my parents would put a stiff book on my head. They tried to keep the book as straight as possible. Once I got out of the way, we made a mark on the closet where the bottom side of the book was.
Below a picture of the paper. On top of the paper the vertical lines for each measurement. The length in centimeters is below most points, together with a date of the measurement. The few date only marks I can still use if I can somehow figure out the length from the mark on the paper. Finally there is a data point marked with “Boek scheef?” 🇳🇱 (Book tilted 🇬🇧). I probably didn’t like it too much that my growth was coming to an end and didn’t believe that measurement.
Plotting the original data
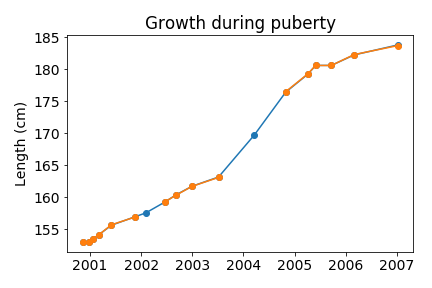
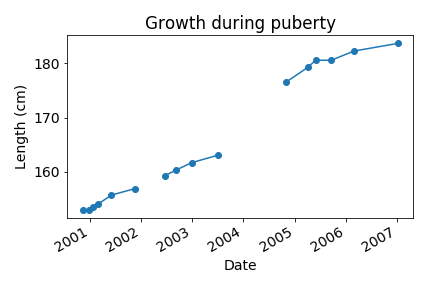
Here I show the data of all complete (length + date) marks. Apparently I had quite a growth spurt during 2004, where I gained around 10 cm in a year! The gaps in the lines show where the two partially complete data points are. Time to find out my exact length on these dates!
Interpolating the missing data
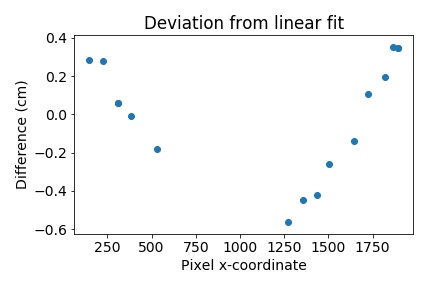
In order to find the length of the date only data points, I noted down the x-position of the pixels of each mark which had a length value. Then I plotted that and I fitted a line through it.
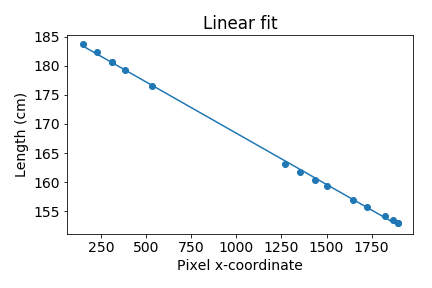
The fit looks quite good, but how good it is hard to judge with such a large range on the vertical scale. In order to better judge the fit quality, I plot the difference between the fit and the real data points. As you can see below, there seems to be some left over parabolic (u or v shaped) background.
At first I thought this background would be due to some distortion of the camera lens. However, after some research I found that camera phones usually have little un-uncorrected distortion.
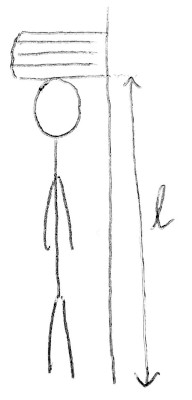
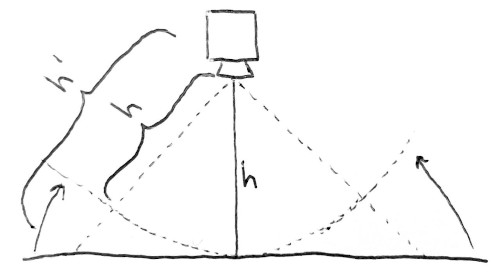
The reason for the difference was more likely to come from the fact that the extreme left and right points of the image are further away from the lens than the points near the middle, as shown in the picture below. I could have gotten the correct lengths in the picture if I rolled up the paper, such that the length segments seen by the camera would all be equal.
You have probably seen this effect in action if you’ve ever been on a road with lettering on it, for example on a bus lane. The letters look elongated if you are close, but if you are far away they look normal. The elongation apparently also depends on the speed limit of the road.

Whatever the reason may be, I decided to add a parabolic term to my fit and I got the following deviation.
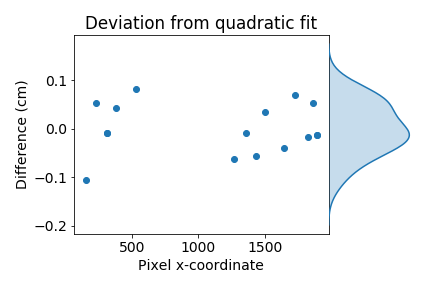
This fit looks much better, because the data points now seem to randomly lie above and below zero. Furthermore the points are roughly normally distributed around zero. What is also nice that from this graph you can see the precision of the measurements. All the points are within +/- 1 mm. Not bad for a length measurement with a book!
The case of the tilted book
Now that I have a function describing the mapping from the pixel value of each mark on the photo to the length in cm, I can plot all the data points. That is including the ones which only had the date written next to it.
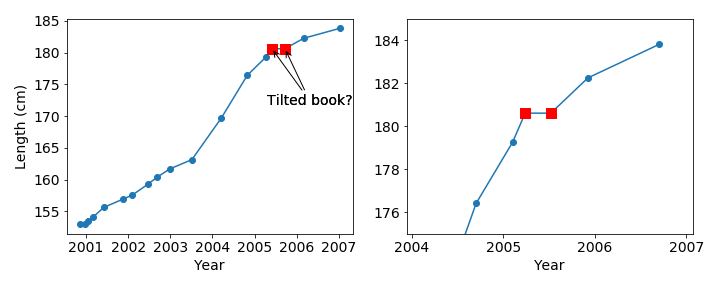
From the plot it looks like the book was maybe tilted a bit too high for the first measurement and maybe a bit too low for the second measurement. Case closed!
Original data versus the corrected data
Finally I compare the original lengths as they were marked on the paper in orange with the corrected ones in blue. The corrected ones also include the date only data points. There is very little difference to be seen between the original and corrected points on this scale. But that is also something we saw earlier when I plotted the deviation from the fit, which was within +/- 1 mm.