- Adding a new HMI project
- Adding the event grid
- Activating the configuration
- Sending a message
- Adding the other alarms
- Adding a custom column
- Pop-ups
In an earlier article, I introduced the PLC part of the TwinCAT EventLogger and showed some useful features. In this article, I go into the details on how to visualize the events using TwinCAT’s web-based HMI (TE2000).
Thanks to Jakob Sagatowski for his valuable feedback while writing this article.
To follow this tutorial, you can either download the completed HMI project, or you can start with the PLC project from the previous article. I’ll assume here that you start with the PLC project part and work your way towards the HMI project.
Adding a new HMI project
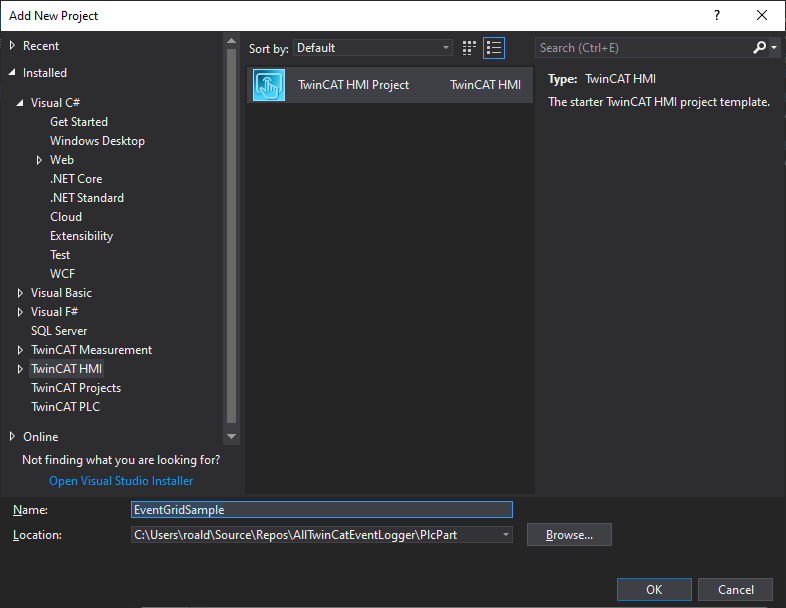
With the solution from the PLC part open, add a new HMI project by going to File > Add > New Project. You should see the following screen. Select TwinCAT HMI Project from the TwinCAT HMI menu and give it a name, for example, EventGridSample.
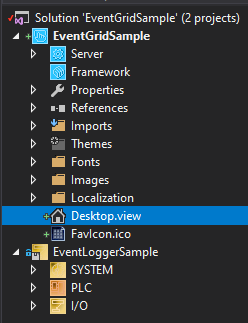
The standard HMI project contains a couple of folders and files. You mainly use the Desktop.view in this tutorial, which is also the default home page.
Adding the event grid
To visualize the events, I’ll use a standard HMI control from the Beckhoff: the Event Grid. You can find some general information and more detailed information about the API of the Event Grid on InfoSys.
To add the Event Grid to an HMI page: open the Desktop.view file and then drag the Event Grid into the Desktop.view from the Toolbox view, as shown below. If the toolbox is not shown, you can activate it via View > Toolbox.
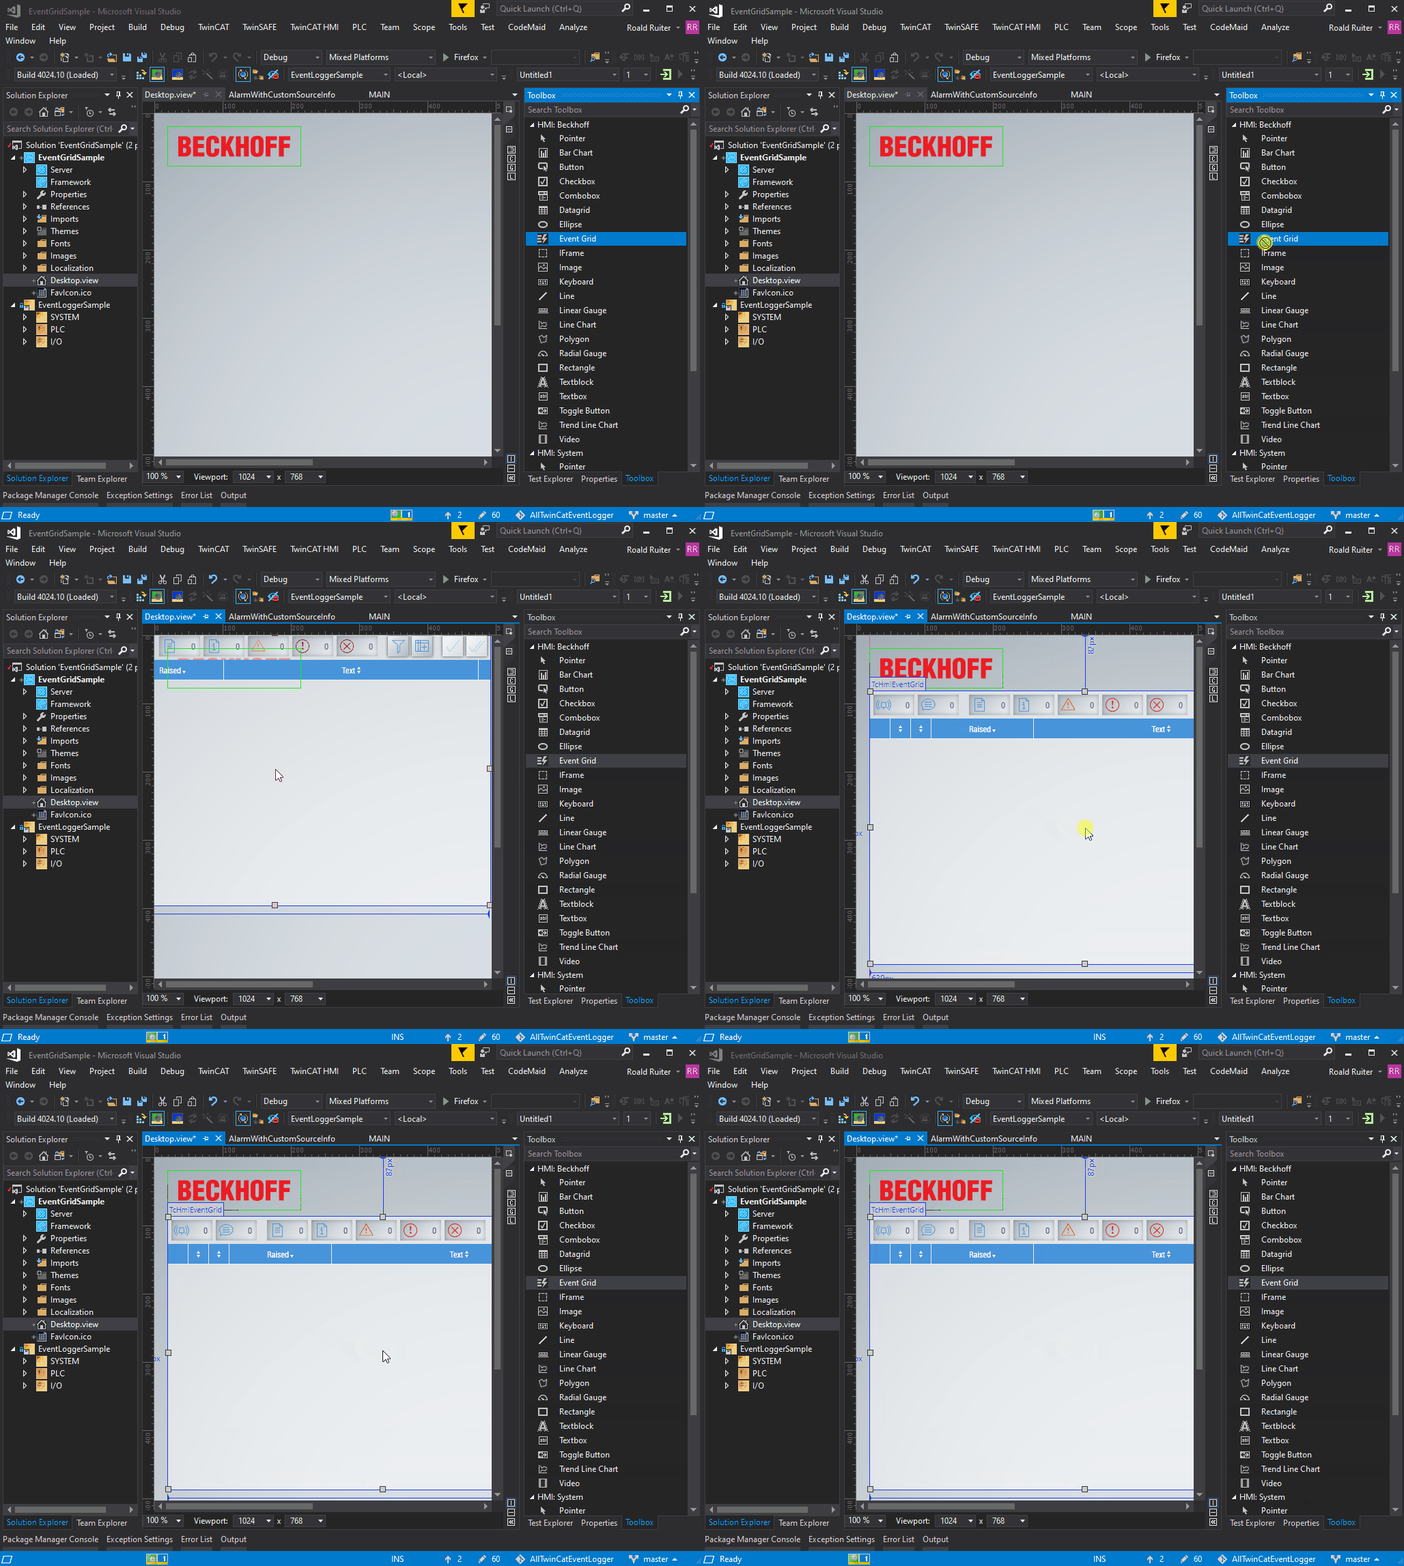
The Event Grid Control provides a convenient interface to all past and present events. It has a few buttons in the top row that allow you to:
- filter/show specific event types
- confirm alarms
- add or remove (custom) columns
I’ll show an example with a custom column a bit further on.
Activating the configuration
Before you can start using the HMI, you have to activate the configuration. Select Activate Configuration and select Autostart PLC Boot Project(s), and click OK. Select OK in the message box to Restart TwinCAT System in Run Mode.
HMI settings for the remote target
I assumed here that you’ll run your project locally. In that case, you can go to the next section. But, if you are running your project on a remote target system, please follow these additional instructions here.
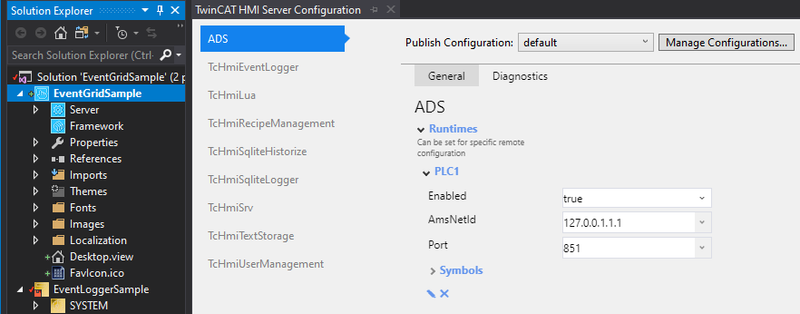
Select a file from the HMI project and go to TwinCAT HMI > Windows > TwinCAT HMI Server Configuration. You should see the following screen. Go to the tab ADS and make sure to select the default publishing configuration on the top right. Then under Runtimes, select the AmsNetId of your PLC and accept the changes.
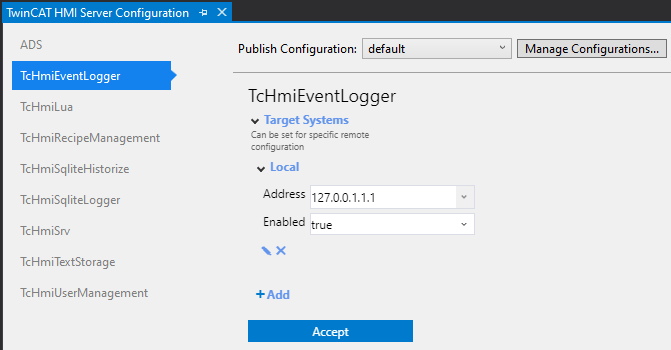
Then go to the TcHmiEventLogger tab. Again make sure to select the default publishing configuration. Then under Target Systems > Local, change the address to the one of your PLC. Accept the changes.
Sending a message
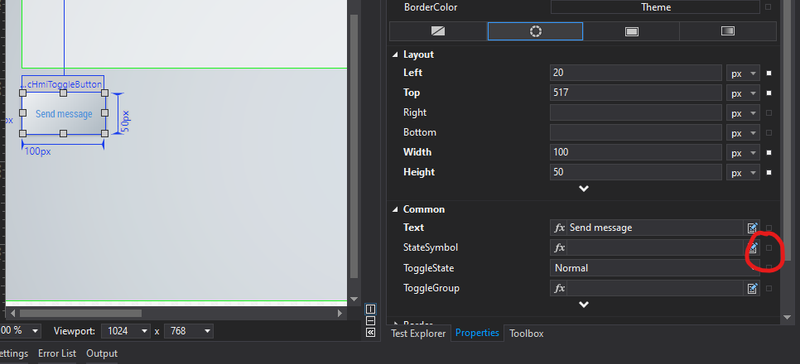
First, you test the message event. To do so, drag a Toggle button from the Toolbox into the Desktop.view. Change the button text to, for example, Send message. Next, you link the button to a variable in the PLC. Click on the small square button, circled in red, next to the StateSymbol and choose Create data binding….
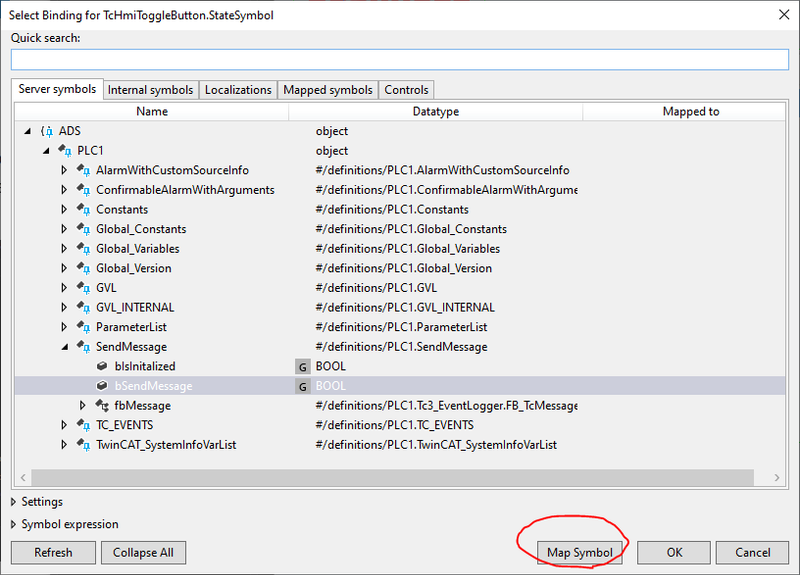
You should see the following window. Select the Server symbols tab and select bSendMessage and select Map Symbol. In the new window, leave the default symbol name and select OK.
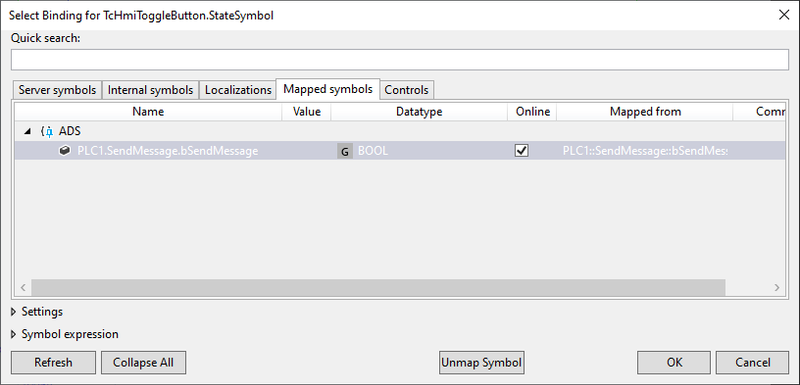
If you now go back to the Mapped symbols tab, you can now link the variable you mapped to the button. To do so, select PLC1.SendMessage.bSendMessage, and select OK.
Live view
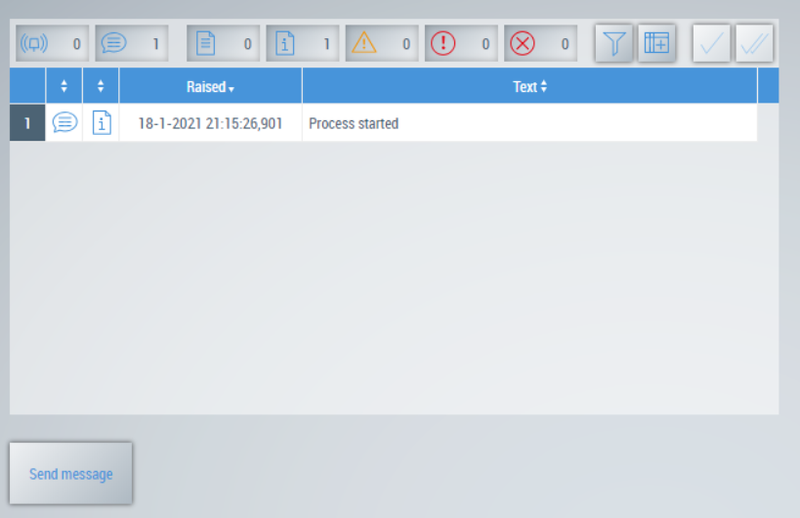
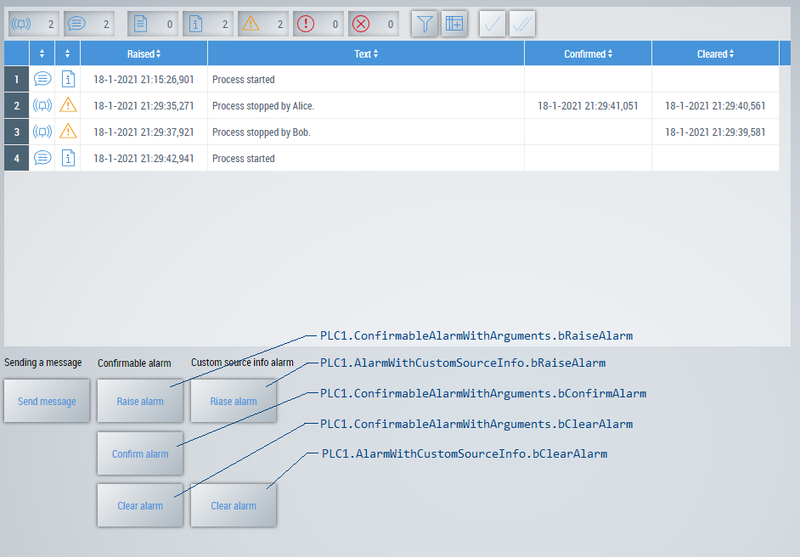
Now it is time to see the event logger in action. You can either publish your HMI project to a remote HMI server or use the Live-View. Here, I’ll use the Live-View since it allows you to see the changes instantly. You can activate the HMI Live-View via TwinCAT HMI > Windows > TwinCAT HMI Live-View. You should now see something that looks like the image below. If you click the “Send Message” button, a new message should appear in the event viewer.
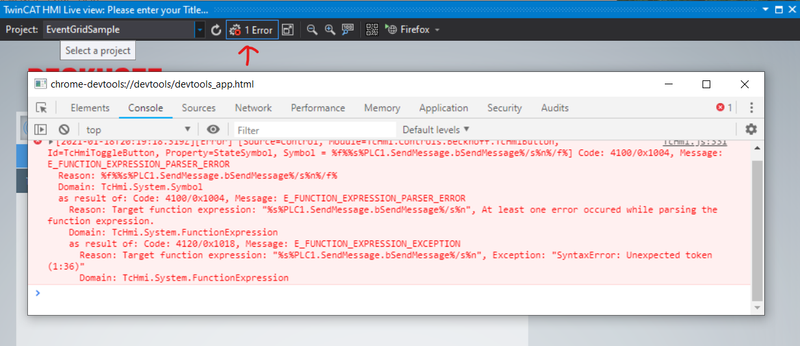
In case you do not see anything, it might be the case that you made a mistake somewhere. If there are errors on the page, this is shown on the toolbar at the top of the Live-View. Click on it to open the Developer tools window. From here, you can try to debug what is causing your issues.
Adding the other alarms
Very similarly to how you created a button to send a message, you can now add some more buttons to raise, clear, and confirm the other two alarms in the project. For each button, they are labeled according to which variable in the PLC they are linked to.
Adding a custom column
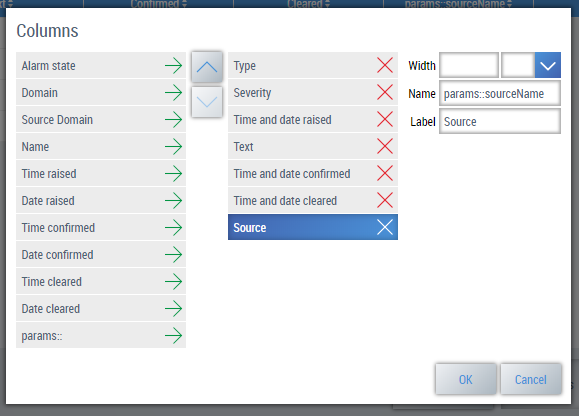
A good feature of the Event Grid is that there are many possibilities to customize it. For example, you can add another column that shows the source of the alarm. To add or remove a column, click the third button from the right.
The following menu is then shown. On the left, you see all available columns, and on the right all the shown columns. Now add the params:: column from the available list. Then on the right for the Name enter params::sourceName and for the Label enter Source. Then select OK to exit and you should see an extra column.
The added column shows the path to the source of the event which can be quite convenient. In this example, it doesn’t add that much, since this is a very small program. But, if the events were a few function blocks deep, the precise path to the source can be handy to trace the origin of the alarm. Note that, as shown in the PLC part, you can also customize the source as I did for the second event. Here I changed the source name to Water pump 3.
Another handy column to add to the HMI event overview is the params::eventClassName. This column shows the Display text of an event class. It can be handy if you, for example, divided your events into component-specific event classes. With the new column, you can now sort your events per subsystem of your machine.
Pop-ups
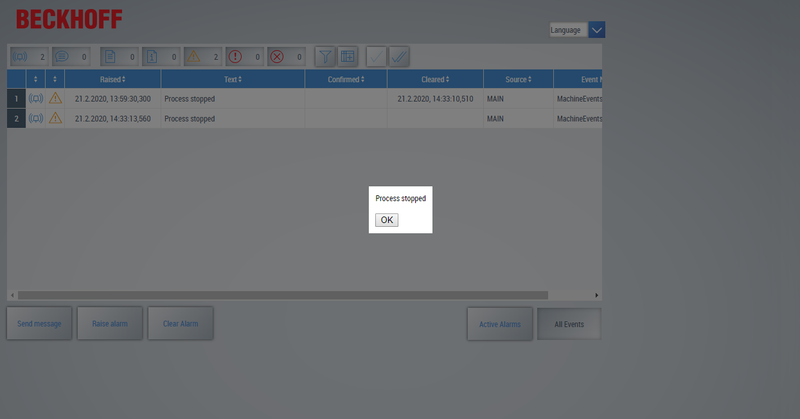
The event grid provides a convenient interface for all events. But, it is easy to miss a raised alarm. Especially if you have various HMI pages and not all contain an event grid control. A good way to grab the user’s attention is through pop-ups.
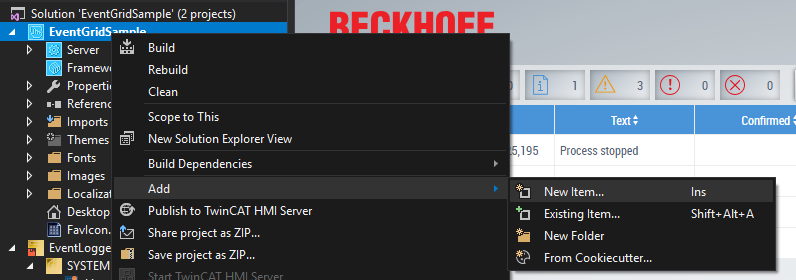
You can add pop-ups by adding some JavaScript to the HMI project. To do so, right-click the HMI project and go to Add > New Item…. Then choose CodeBehind (JavaScript) and pick an appropriate name. This adds a JavaScript template to your project. The file already contains some boilerplate to make it work with a TwinCAT HMI project.
I added the following code to create the pop-up. First a composeHtmlPopUpElement function with a single argument event where you can pass the event data to. The event data contains the event.text which is placed in a <div>. The event data type also holds more information about the event, such as its severity (warning, error, or critical) and the time it was raised. Furthermore, it adds an OK button to acknowledge the pop-up. The OK button removes the topmost layer from the HMI, in this case, the pop-up itself.
function composeHtmlPopUpElement(event) {
  return $(
    '<div style="background:white;padding:10px;max-width:400px;">' +
      event.text +
      "<br><br>" +
      '<button type="button" onclick = ' +
      "\"var topLayer=document.getElementsByClassName('tchmi-in-topmostlayer');" +
      "var currentTop=topLayer[topLayer.length - 1];" +
      'TcHmi.TopMostLayer.removeEx($(currentTop));"> OK' +
      "</button> " +
      "</div>"
  );
}
Next, I defined a function that is called whenever a new event is raised. The function adds the html pop-up element, returned by composeHtmlPopUpElement(), to the topmost layer of the HMI page. So, each time the function is called, it places a new layer on top of the previous one. In practice, this means that when multiple alarms are raised, a whole stack of layers are placed onto your HMI. Of this stack, the topmost layer is from the most recent alarm.
function showPopUp(event) {
  var newPopUp = composeHtmlPopUpElement(event);
  TcHmi.TopMostLayer.addEx(newPopUp, {
    centerHorizontal: true,
    centerVertical: true,
    removecb: (data) => {
      if (data.canceled) {
        // user clicked on the background
        TcHmi.TopMostLayer.removeEx(newPopUp);
      }
    },
  });
}
Next, I defined a function that is called whenever a certain type of alarm is raised and it gets passed some data about the event. In this example, I only want to show a pop-up when an alarm is raised.
function subscriptionCallback(data) {
  // check if the callback object is valid
  if (data.error === TcHmi.Errors.NONE) {
    // check if an event of type alarm is raised
    if (data.changeType === TcHmi.Server.Events.ChangeType.AlarmRaised) {
      showPopUp(data.event);
    }
  }
}
Next, I made a filter to select the type of events I want to show a pop-up for. In this case, I only want to get a pop-up if it is an alarm (warning, error, or critical) and is not yet confirmed.
let allActiveAlarmsFilter = [
  {
    path: "type",
    comparator: "==",
    value: TcHmi.Server.Events.Type.Alarm,
  },
  {
    logic: "AND",
  },
  {
    path: "timeConfirmed",
    comparator: "==",
    value: new Date(null),
  },
];
Finally, the filter and the callback function get registered. That means that they listen for any new alarm which gets raised.
TcHmi.Server.Events.registerConsumer(allActiveAlarmsFilter, {
  subscription: subscriptionCallback,
});
If you now raise a new warning, a pop-up should appear in the HMI. You might need to rebuild and/or refresh the Live-View for this to work.
I hope I gave you a good introduction to the EventLogger so that you can start experimenting with it yourself.
Discuss: reddit.
